What are Relationships in Tableau- Really?
Diving beneath the hood of relationships to compare them to joins -and using SQL to understand what's really going on.
BUSINESS USERS
Annie Nelson
6/8/20248 min read
I have heard so many times that relationships are basically like joins - but not quite. If you've been using Tableau for any amount of time, you have likely also heard a vague explanation such as this one. Apparently relationships are superior to joins when handling tables at different granularity levels, but I have always had a hard time really understanding why. So today, we are going to find out.
Why I Care (My Pain Point)
I work at a company that builds software, so I have a lot of smart and technical people around me. We have a well developed database, we use DBT to create and document our tables, and we not only have many data analysts who are strong SQL users, but we are one of those tech companies that also has many analytics engineers on staff. Basically, I am surrounded by a lot of SQL users who are the most comfortable with managing our data in the data warehouse.
When it comes to Tableau, we are less experienced. My company has been using Tableau for less than a year now, and we are still getting the hang of all of our best practices and work flows. Generally, we try to move all of our business logic away from the viz layer (calculated fields and custom SQL) and into the database (in the Snowflake tables we connect Tableau to).
This is why up until now, we have been trying to get all of our important reports into one big report table. This way, the SQL and business logic is under change management in the database, and can be monitored and controlled by our many SQL users.
However, I have recently come across a strong use-case for relationships. I have a dashboard where we want to show targets compared to actual values. This means that we need:
An Actuals table - at the granularity of Date, and Opportunity ID (Order ID)
A targets table - at the granularity of Date, and a "Dimensional Key" (e.x. Region, Sales Segment, Lead Source)
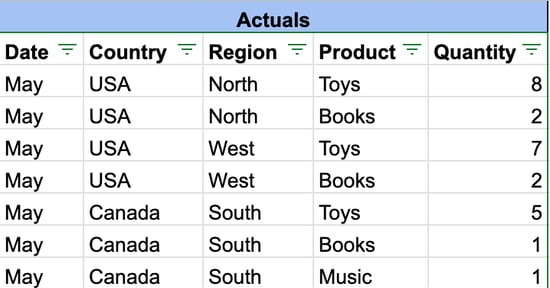
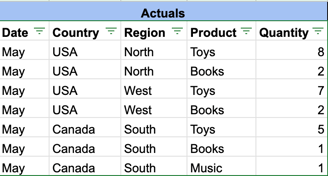
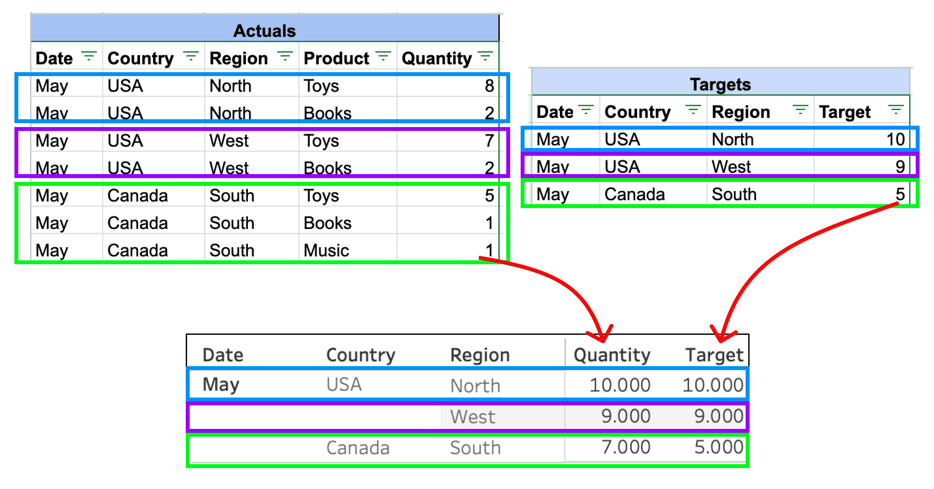
At the grain of Date, Country, Region, & Product
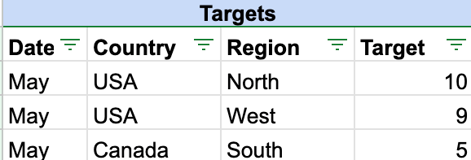
At the grain of Date, Country, & Region
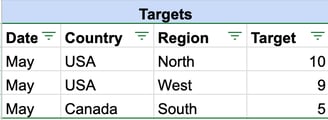
At the grain of Date, Country, & Region
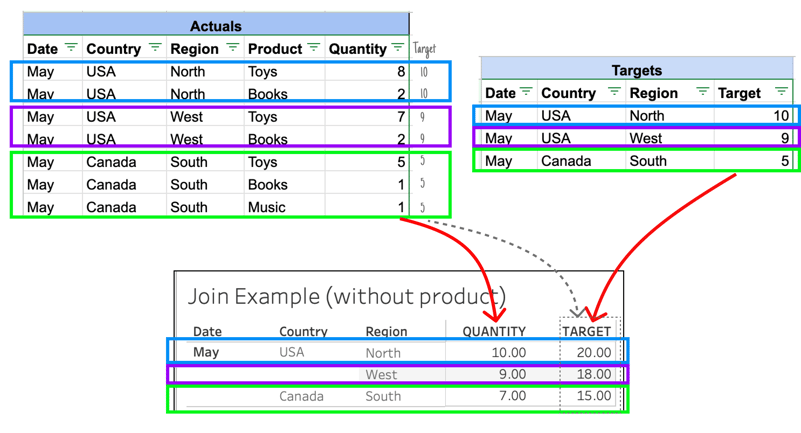
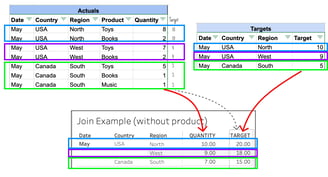
In the example above, the join is performing the following math:
USA - North 10 + 10 = 20 (Target- North: Toys: 10 + Books: 10= 20)
USA - West 9 + 9 = 18
Canada - South 5+ 5 + 5 = 15
Do you see the problem here? Product is at a different grain from Region - and if we join the two tables together, there will be duplicates in the Targets column.
So far, so good. But the problem arises when we try to join these tables together. I will show you.
Join Example
Let's bring back my visual from earlier to see what happens when we try to join these two tables together. The SQL engine will take every row it finds and add it together, with the relevant grouping:
Please note that I am using Date, Country, and Region from the Scaffold table in each example where I bring the tables together.
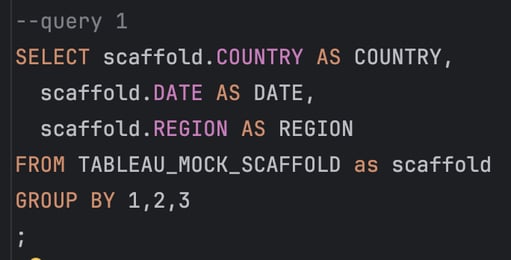
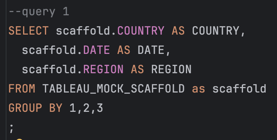
For my SQL users here, if I send the following query to my Snowflake database, I get the same results. I built these sample tables in my Snowflake database to show how the SQL would work:
Okay, so we see the problem. Now that we have built our case, let's see how a relationship can fix the problem, and if we can take away an explanation as to how that leaves others going "okay, I can trust that".
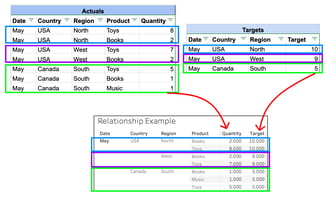
Relationships Example
For the purposes of this example, I created each of our three tables in my Snowflake database, and then connected to them in Tableau. Here is my data model:
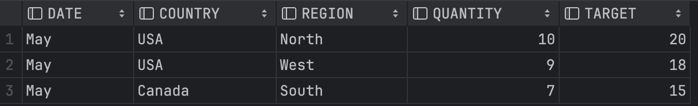
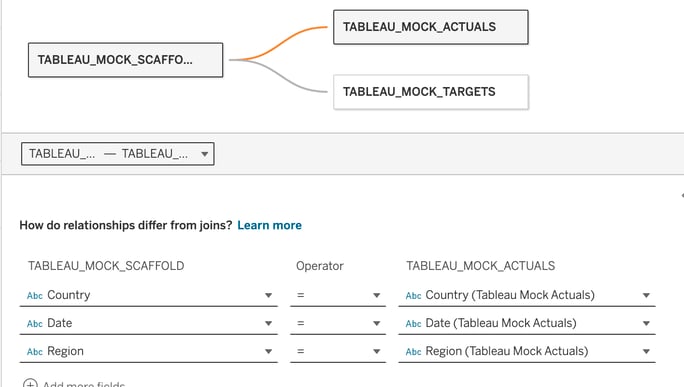
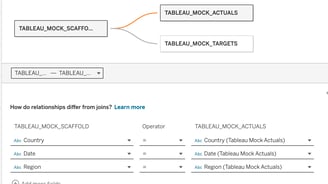
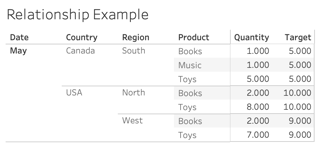
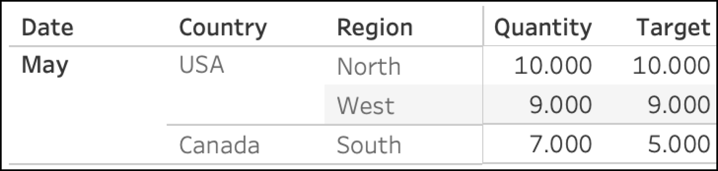
I have created the same type of data model as before, but now it is using relationships instead of joins. However, when I create the same table as before- Date, Country, Region, Quantity, and Target; the duplications magically disappear!
But how did this happen!? I am not using any LOD's or crazy calculations. In Tableau's documentation they mention that relationships maintain each table's level of granularity - but that was not enough of an explanation for me. Fortunately, I can see the queries that Tableau sends to Snowflake in SQL when I am using a live connection.
I went and copy and pasted the query that Tableau sent, and was surprised to see that it actually sent more than one query. As a matter of fact, when I looked more closely, I realized that Tableau was essentially querying the Targets and Actuals separately, and then just putting those numbers onto a sheet together.
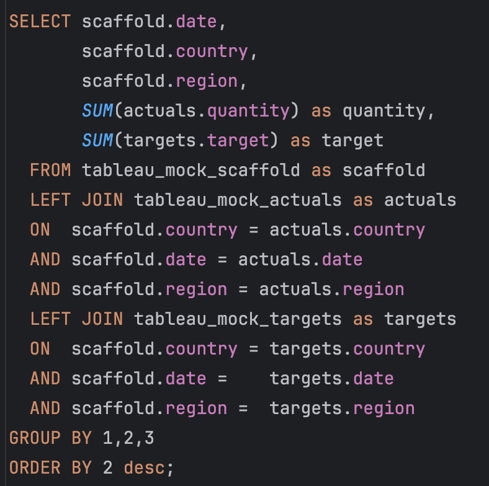
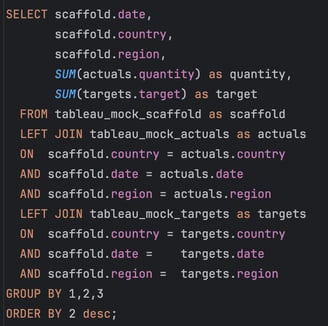
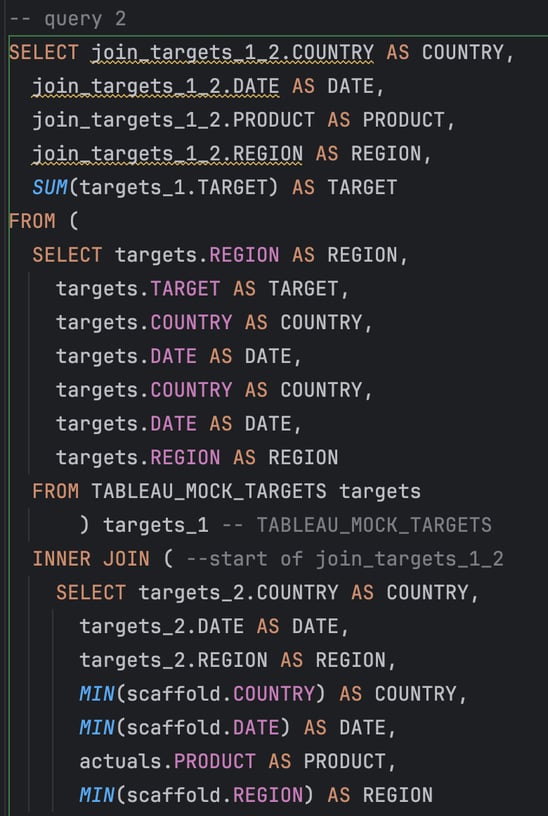
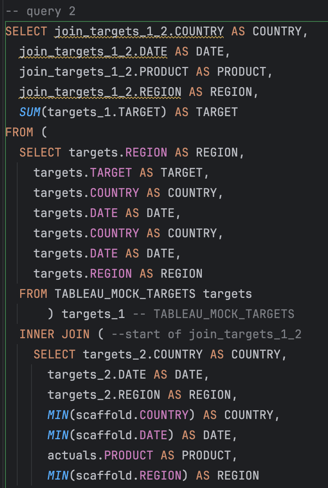
I changed the query a little bit to remove extra symbols and make the aliases more readable, but here are the queries that Tableau sent to create the table we see above (Relationship Example without product):
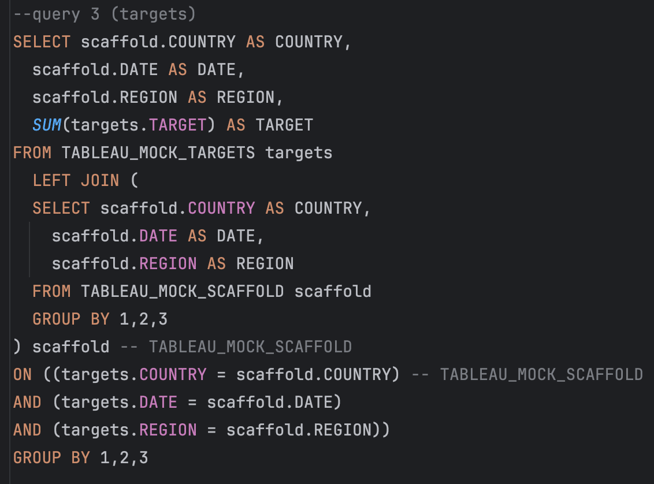
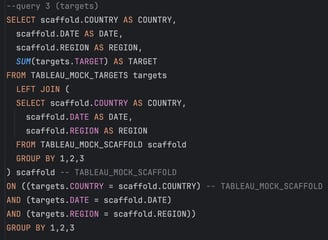
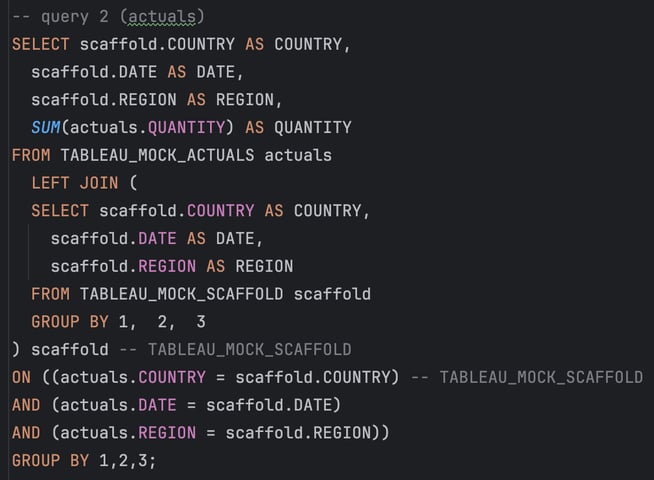

Here it is, the Tableau relationship - demystified. This is how it was able to get the Actuals and Targets (two tables at different granularities) onto the same sheet without any duplications.
Tableau joined the two tables by not actually trying to join the tables. Instead, it just queried the Actuals and Targets individually and returned the results.
My Conclusion About Relationships
Obviously this is a basic example, but that was the point. I wanted to see what was going on, in a way that I could understand. Now I can see what Tableau means when they say they "maintain the granularity" of each individual table.
My conclusion from this is that if someone asked me
"How could I query the actuals or the targets to get the same results as you have in Tableau?",
I would answer by telling them that they can query the tables separately, without joining them together.
The answer that they get from those queries will match the answer that Tableau gives for a combined table.
I have already explained this to one stakeholder, and she seemed pleased with my answer. Most of the time she is actually looking at one table or the other, so not having to involve both tables at once to just get a simple answer for "What was my target in USA - North in May?" by querying the targets table is the best answer for her.
Adding in Product to the Table
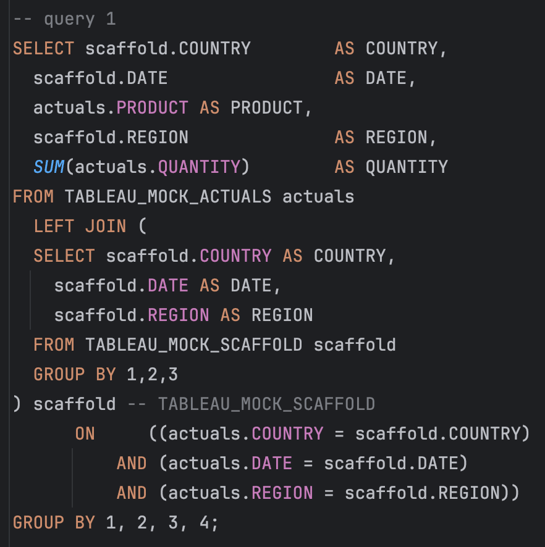
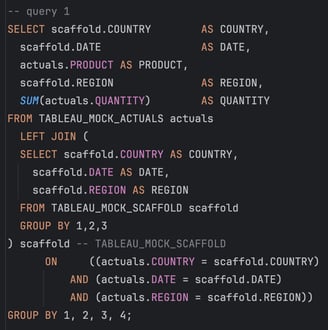
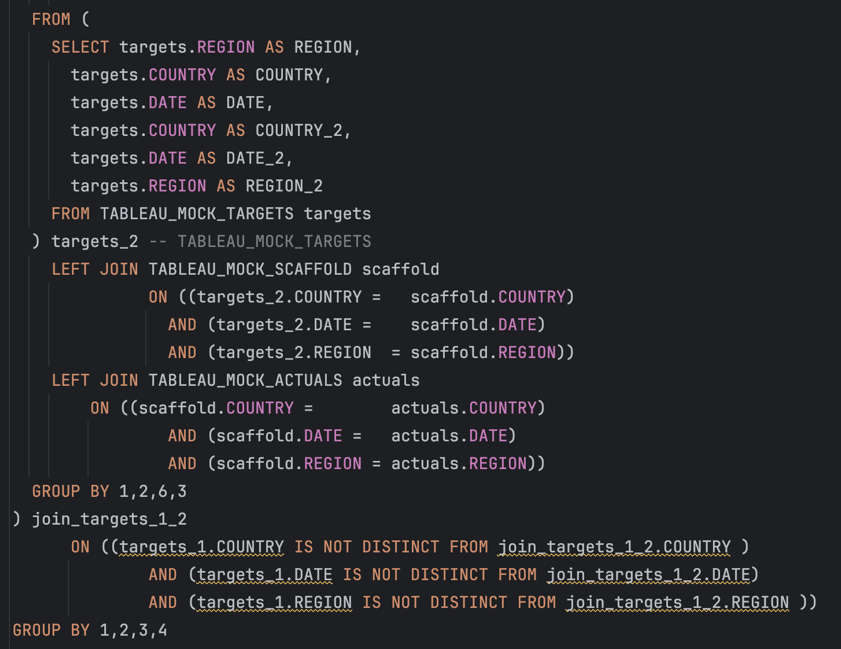
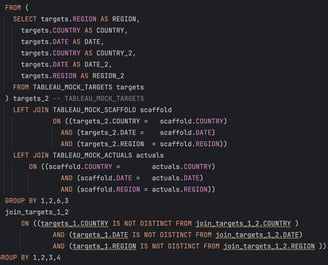
Out of curiosity, I wanted to see what SQL Tableau would send if I did bring product into the table.

This is what the table looked like when I included product in it. The SQL for this table was a little bit more complex, but after some thinking I can see that it is still applying the same principles.
This query is pretty long, but if you're a regular SQL user, I am guessing you will be interested to see it!
This is where my exploration stopped, but I kept a careful log of all of the queries that Tableau sent in SQL. I created this example so that you could reproduce it and test it yourself, if you wanted!
Try It Yourself
If you just want to see all of my testing materials in their more "raw" form without the whole blog, you can find them here:
In my spreadsheet, there is a tab called 'Query' where you can find the query you can run (with modifications for your database) to create this table in a temporary location so that you can connect Tableau to it. The simpler way would be if you could upload the sheets directly to your data base, but this just manually creates them.
Just copy and paste this into where ever you run SQL, replace the database connection path, and then run each query at a time to create your tables. Then they will be ready for Tableau or SQL!


We already know that the best way to bring these tables together is by using a scaffold with the "Dimensional Key", Date, and date spine as the base table to join the two, but here's the problem:
If we try to join these tables using a traditional join, we will get an artificially inflated number for the targets, due to the way that the two tables at different granularities will produce duplicates in the targets table.
Not great. I realized that this is the perfect use case for a relationship, but I knew that I would have to peek under the hood and learn to explain what a relationship actually is before I could suggest driving a key report for the company off of this style of data model.
Otherwise, nobody would be able to reliably validate or query against the data model I intend to create, because there would always be an x factor of how Tableau was querying the data to arrive at an answer to show on screen.
The Experiment
I scoured the internet looking for a simple and digestible example of what a relationship in Tableau actually is - and what is going on in SQL when you build a data model with relationships. However, I struck out. The examples I found showed the end product of a relationship, but nothing to help me unpack what was really going on.
That's when I knew- I would have to put one together myself.
I decided to design a very simple experiment that you could replicate yourself - and it would show me the difference between a relationship and a join, and give me the SQL to show for it.
The Data
Taking inspiration from the Superstore data set, I put together a simple little dataset with three tables:
Actuals
Targets
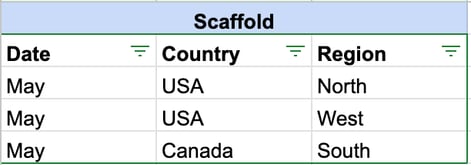
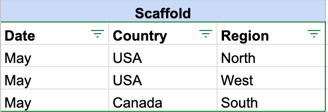
Scaffold
The scaffold would need to contain every dimension combination I would need in the workbook, and then instead of using dimensions from the Actuals or the Targets, I would use it from the scaffold. If you are unfamiliar with the concept of a scaffold, do not worry. It is not a central point to this post - even if you do not quite understand why I needed a scaffold, you can still follow along about the relationships.
Here are the tables I built (see them in GSheets here):